Trackonomics Features

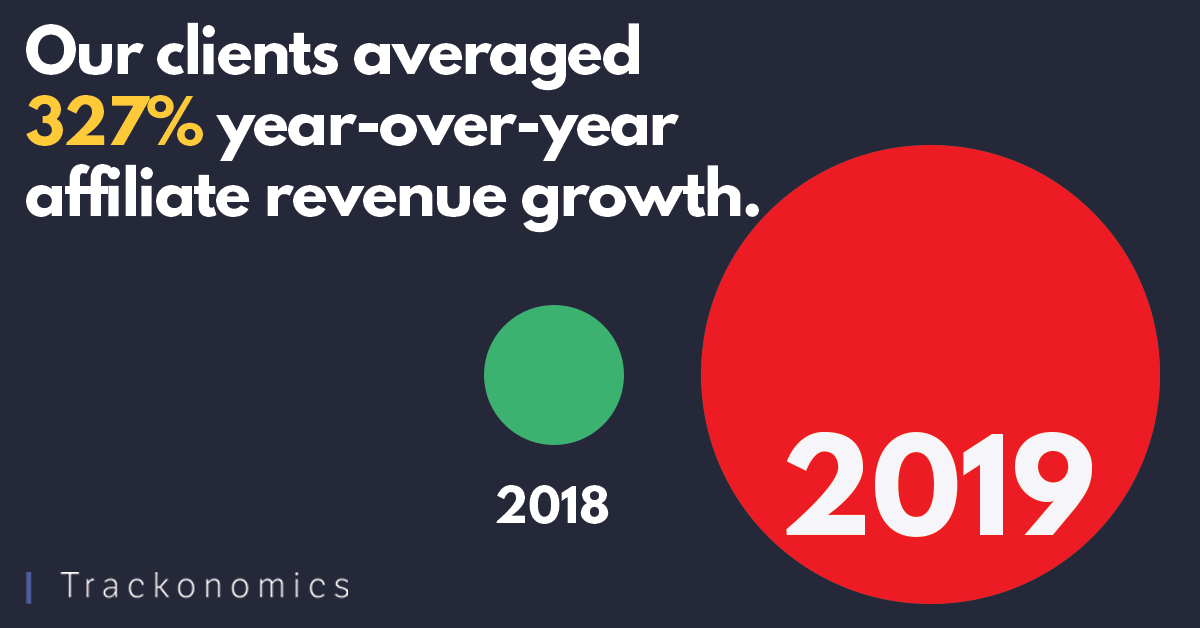
We do so much more than data consolidation.

As recently as a year ago, it was enough to consolidate multiple affiliates on a single dashboard. This is no longer the case. Our clients’ sophistication has gone beyond what the traditional affiliate industry has to offer, and now publishers need to analyze their performance data in richer and more complex context such as SEO, paid acquisition campaigns, social traffic and audience segmentation.

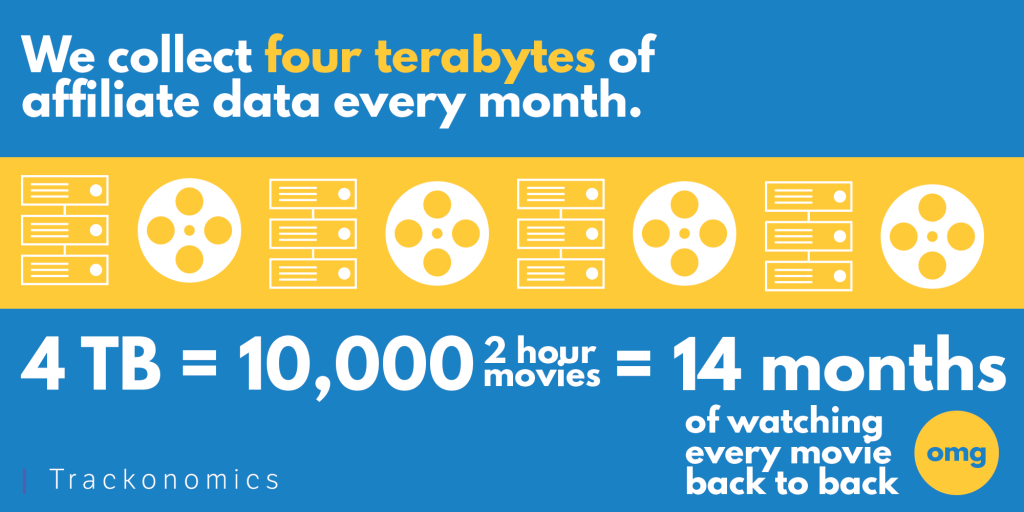
They need to be able to collect and segment data that is not available on most networks. What they need is a Data Management Platform, and we are thrilled to deliver it. Trackonomics has effectively launched the first Data Management Platform for Affiliates, and it’s currently the only one on the market.

What are DMPs?

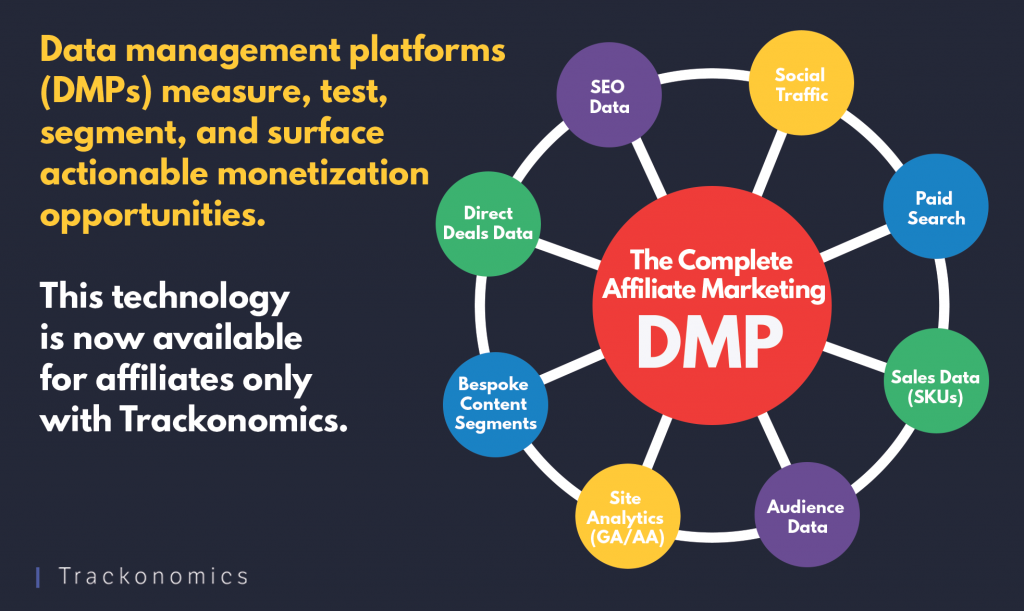
A DMP (Data Management Platform) – is a software used by marketers to measure, test, segment, and surface actionable opportunities for monetization from within a sea of data points and audience metrics. Programmatic/RTB professionals use DMPs such as Nielsen or Adobe all the time as part of their regular arsenal of tools – and now, so can affiliate marketers!

For years, we have seen publishers and advertisers need affiliate marketing to be more accessible, more fluid, and more manageable – essentially, they need more scalability for their businesses. The most direct route would be  to bring the product standards from programmatic advertising into the affiliate world. Aligning the real-world needs for affiliate growth with technological advances has been a challenge, but it’s been worth it. This platform delivers functionality specifically designed for today’s (and tomorrow’s) affiliate landscape.

How publishers can use DMPs for affiliates:

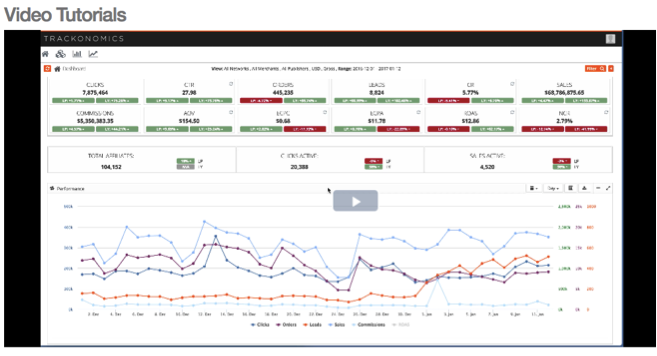
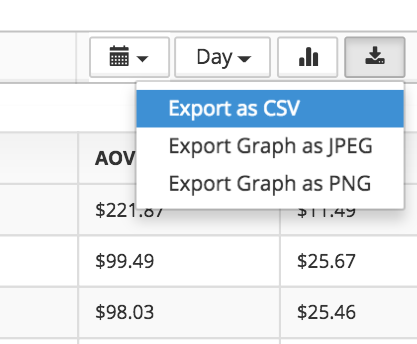
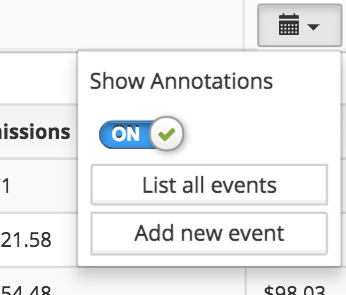
The latest advances in Trackonomics enable publishers to analyze and optimize their affiliate links at page level and get near real-time insights into the performance of their content and links. 

They can interlink the following to provide unprecedented mapping of user and content flow and behavior:

  • Create bespoke ‘live’ data segments from within their websites 
  • Track their performance by sections or editors

 Pull data from a variety of data sources including:

  • Adobe Analytics/Google Analytics
  • Google Ads
  • SEMRush 
  • and many others 

Publishers can even measure direct audience engagement with affiliated content: from page views and time on site all the way down to individual (and even user-specific) purchases by integrating Trackonomics with audience tools such as Tealium, Segment or Signal, which in turn allows them to ensure offers and merchants are user optimized.

This is only the beginning. This transformation is allowing us to re-imagine how the affiliate industry could work and to build the tools that will make those changes happen. Prepare yourselves for an incredible 2020 – it’s going to be a landmark year for the industry.

Cheers,

Hanan Maayan

In the few years since large scale digital publishers entered the affiliate arena, they have advanced the use data to drive growth dramatically… We’re talking on average, 327% year-over-year growth. 

Just last year, it was enough just to get multiple affiliate networks on one dashboard. That’s no longer the case. Publisher challenges have changed, and we at Trackonomics have made great strides to adapt our products to help them succeed. 

How have we been doing this?

Doubled our server capacity.

The amount of granularity publishers need has grown tremendously. As have their affiliate efforts. Publishers are producing a lot more content. More links means more activity, which means more data. And more data. In order to keep up with the amount of information coming in, we’ve beefed up our servers which are at the moment collecting over four terabytes a month. That’s almost half as much data as what the Hubble Space Telescope collects in a year. Or to put it in more relatable terms, four terabytes can store 10,000 two-hour movies. If you played those movies back-to-back? It would take 14 months to watch.

In other words, we can store a sh*t-ton of data (pardon our French).

Launched a new dashboard.

Say what? Yeah, we went there. The old dashboard got most of what publishers needed, but since things change so quickly, we came up with a more flexible solution. With this new dashboard, every client can generate bespoke reporting, which includes data visualizations built in seconds with a selection of more than 50 data parameters. Improved functionality includes, shareable widgets for better team collaboration, contextual data layering for deeper insights making affiliates not just valuable for their commissions, but also for the information they collect.

We can now show data at the article level.

The need for article level affiliate data was quite possibly the biggest development we saw with our clients. The value each article can generate has become the metric in measuring the success and determining how to shape future content.  We noticed that almost everyone was trying to figure out how to get data at the article level. Fortunately, we had technology that just needed a tweak to focus specifically on the articles. 

Now, at the page level users can merge affiliate with non-affiliate data. With this enhanced centralization of data sources, clients get the context they need to analyze performance against: 

  • Traffic (Adobe / Google Analytics)
  • SEO keywords (SEMRush)
  • Search volume (SEMRush)
  • Referral sources (Funnel Relay)
  • Campaigns (Funnel Relay)
  • Partnership data (Funnel Relay)

Given the new dashboard can display the above data in a multitude of ways, publishers can push for even greater advances and tremendous affiliate growth in Q4 as well as for 2020.

While there is still more to come, we’re slowing down actual development for Q4 to focus on helping clients through their busiest and most lucrative time of year… the holidays. We’re excited to see the results of the evolutions both from the publishers and from the tools we’ve made to help them.

Get in touch to learn more about how Trackonomics can help you grow your affiliates.

Beautiful & Powerful

Every publisher has a unique way of looking at data. This requires flexibility not only because everyone is different, but because data needs shift constantly — whether on a dime or over time. So it’s absolutely critical to have access to a dynamic solution that can fit the ever-changing nature of this industry.

We are excited to announce the ‘open Beta’ phase of our new Business Intelligence dashboard – a *very* different beast, in both form and substance. Beautiful enough to visualize your data insights clearly and efficiently. Powerful enough to handle multiple data types, making it possible to blend transactions, referral sources, SKUs and KPIs in an unlimited amount of ways.

So now it’s infinitely easier to understand your content’s value.

  • Business Intelligence and Analytics. This new platform, built from the ground up, is a comprehensive business intelligence tool, fully customizable, and connected to over 85 different data sources. With new rollout of the platform, every client can create a bespoke platform, which includes data visualizations built in milliseconds, choosing from more than 50 data parameters. Improved functionality includes, sharable widgets for better team collaboration, contextual data layering for deeper insights, and an array of premade widgets and screens to get our clients started right away.
  • Article-Level Reporting: Publishers need to understand how content performs in great detail in order to grow business. Knowing what types of content perform best facilitates decisions about which content to optimize. Trackonomics has tools that streamline the process, allowing informed decisions on creating better content that will make more money.
  • Customized Data-Set Collection: Publishers no longer have to rely on affiliate networks to provide the information they need, publishers can set customized parameters to collect directly from their content with a fully automated and standardized process using Funnel Relay. Funnel Relay offers endless extracts of important data from a content article such as author, title, and how the site visitor found the article. The solution provides endless possibilities by automatically grouping this information and delivering the extracted data directly to the dashboard, ensuring revenue and ROI can be tracked to an article level, or even link level.

Uncover the value of content by collecting the right affiliate data. Get in touch to find out how we can help.

Publishers Have Relied On Fragmented Data For Too Long

Affiliate marketing has consistently implied a notion of distance between publisher and advertiser.

The gap is normally bridged by an affiliate network or agency.

This has caused publishers to operate with one-hand tied behind their backs.

When sending the world’s biggest e-commerce company’s traffic and sales, publishers have constantly relied on pieces of data from affiliate networks about the clicks and sales they have generated. But they have never been able to tie that crucial transactional data back to their own inbound traffic data and on-site analytics.

Publishers in affiliate marketing know how well they are performing for their advertiser partners. However they have lacked the ability to connect conversions with their own analytics and traffic acquisition.

User Journey Visibility Is Broken

Working with this crucial bit of the picture missing means even the industry’s biggest publishers have never been able to confidently assess a user journey in this way…

  1. User X was acquired through this marketing channel (let’s say a paid Facebook Ad)
  2. The user was sent to advertiser Y
  3. The user purchased these 3 products
  4. And spent £180 on the purchase

Stages 2, 3 and 4 have long been available to publishers via affiliate networks.

How the user was acquired to the publisher’s website in the first place has always sat disconnected from the other parts of the user’s journey. This is the critical starting point. This level of detail that is actually vital for publishers.

The key to helping publishers better optimise their businesses is knowing which traffic sources and traffic generation strategies drive the most conversions and the most valuable customers. Most publishers are only being paid when they drive sale-converting customers. This adds to the importance of knowing where those valuable users are coming from.

Closing The Loop

We have a unique insight into this challenge as we support some of the world’s biggest media publishers. We have witnessed the struggle of publishers with incredibly high traffic volumes. Publishers with a varied range of sources were frustrated by their inability to properly optimize their affiliate campaigns.

When publishers tried to repeat a successful formula for a campaign this problem manifested itself really clearly. Their issue? They didn’t know why a campaign had worked. They had no visibility on how that campaign had generated the specific, converting traffic that made it successful.

To help publishers overcome this challenge, we built Funnel Relay. The goal of Funnel Relay is to close the loop between traffic acquisition and conversions for publishers. This finally helps publishers in affiliate marketing to properly measure their own return-on-adspend.

An Industry First

Funnel Relay is the affiliate marketing industry’s first end-to-end customer journey tool. Publishers of all sizes can use Trackonomics to report their affiliate sales by in-bound traffic source. They do this by integrating a small code snippet on each page of their site where affiliate links are running,

A publisher can now break down their affiliate sales by paid or organic campaigns across Facebook, Instagram, Pinterest, Search and many more.

Publishers can visualise their traffic acquisition in flow charts using the Trackonomics dashboard. This helps to understand where the traffic acquired from various channels goes once it leaves their website.

Positive Feedback From Publishers

Having trialled Funnel Relay with a focus group of key publishers over the last few months the feedback has been unequivocally positive. Publishers have said:

  • The end-to-end visibility on affiliate journeys is unrivalled in the industry
  • The data now plays a key role in traffic acquisition strategies
  • The information directly feeds into budget and planning for paid campaigns

We’re delighted to announce that Funnel Relay is now available as a standard part of the Trackonomics suite of publisher-facing tools, all built with the aim of helping publishers in affiliate marketing make each link worth more.

We’re excited to announce the launch of our new branding and website. It’s part of a general refresh that will see major changes in the look and feel of our dashboard, as well as brand new functionality which is all coming soon!

We’d love to hear your feedback on our new look. Please feel free to get in touch and tell us what you think!

We are excited to share with you some new features now appearing on the dashboard!

Daily News Ticker

  • The daily news ticker is our hand-picked selection of industry-related articles. We post news every day so that you can stay in the know about what’s going on in affiliate marketing. You can find this new feature moving across the top of the dashboard.

Dynamic Network Fee

  • Dynamic network fee integrates fees automatically from the networks and shows all changes historically. For networks that don’t provide the fee, you can customize and update percentage of sales/commissions for each account/network. With the dynamic network fee, you know exactly how much commission you will be earning from a particular account.

Monthly Sales Target

  • Monthly sales target allows you to set and manage monthly sales targets for a single account over an entire year. You can compare your monthly sales target to actual sales in the adjacent sales column. Throughout the month, you can use the paced forecast to see how sales are measuring up to the monthly target.

Trackonomics: a real power-tool for affiliate marketers

Affiliate pros use many tools for day to day management of programs. Whether on the publisher, advertiser or agency side, these tools are used for content marketing, email campaigns, SEO, social media management, and the list goes on. Surprisingly, until now, there was nothing on the market that combined data aggregation, consolidation and account management all into one platform. It was deemed ‘too difficult a challenge’ by many developers to even seriously contemplate it as an ‘enterprise solution’. But that’s exactly what we’ve built and what we’re all about: so spruce up your toolkit, affiliate marketers, this is the tool you’ve all been waiting for!

Efficiency & productivity

Data consolidating from various networks and programs into one place is possibly one of the most time-consuming and error-prone activities that we ALL have to do, every week, every month, and sometimes every day. With Trackonomics, you can quickly and painlessly onboard all of your network accounts and programs into one dashboard, which will then pull your data as often as you need it. You will never need to log in to your affiliate partners in order to download reports – ever again! With Trackonomics, you will have one login access to all your data, with powerful analytics and segmentation tools which will help you compare and analyse your data across your entire activity for as far back as months and years – in just seconds!

Accuracy & reliability

No other company has poured the amount of time and effort we have in order to ensure the integrity and reliability of our affiliate data collection processes. Everyday, we pull the equivalent of several ‘decades’ worth of data for our clients, while successfully keeping the failure rate at under 0.1%. In order to further our clients’ trust in the data collection systems, we have created client-controlled validation and recollection procedures that ensure that the data is always updated and correct. We have a deep understanding of the structures and syntax of every network that we work with; additionally, we offer dimensions that are often not easily accessible even in the networks’ own UI.

Management & monitoring

We’ve always strived to go beyond ‘simple reporting’, and provide Affiliate Account Managers with powerful and relevant management tools which can make their lives easier and clients happier. With Trackonomics, you have the ability to create and plan campaigns and analyze the bottom line a-priori, using your real data. You can annotate your performance graphs, upload excel charts and centralize all your publisher/advertiser activities in seconds. You can set traffic or performance alerts, manage the media assets you want to show, manage your users’ access permissions, and so much more…

Trusted & field-tested

If this sounds good, it’s because it really is. And this is why we are proud to count as our clients some of the biggest names – not just in the affiliate industry – but in the entire world! As the list of advertisers, publishers and agencies that we are proud to call our clients grows, so does the performance of our platform and the sophistication of the features we are able to deliver.  Register now for a free trial and see for yourself, or send us an email at contact@sergiu.olivestudio.net for more information about our products and services.

Are you just getting started with Trackonomics? Need a little help with some of the widgets on the dashboard? Check out our tutorial videos that can help you navigate the dashboard.

WHERE ARE THEY?

Click on the video icon at the top of the dashboard.

WHAT ARE THEY?

These tutorial videos average in length from one to three minutes. They focus on the widgets which people use most on the dashboard.

WHAT’S NEXT?

We encourage our users to comment and request future tutorials. Currently, tutorials are available for agencies and retailers. However, stand by for publisher-view tutorial videos on the dashboard soon.

HOW DO I START?

Step 1 is to onboard your networks to the dashboard. Watch this 20-second video tutorial about onboarding networks.

Curious about what you can do with the performance widget? Here are three key features: 

  • Time frame display
  • Download data in Excel
  • Annotations

Time Frame Display

1. The first feature is time frame display. At the top of the performance widget is an option to view data for a day, week, month or year.

In addition, you can view this information as either a graph or a table at the top of the performance widget.

Also, if you want to customize the time frame, click on Filter and in the Filters Manager change the Date Range.

Exporting Data to Excel

2. The second feature of the performance widget is data exporting. You can export all of the data in the performance widget into an Excel file, either grouped by day, week, month or year.

Annotations

3. A final feature of the performance widget is annotations. You can annotate your KPIs and events by clicking the calendar icon and turning the annotations on (annotations are turned off by default). Once you turn on annotations, you can see different events (i.e. tests, promotions) in the time frame you selected.