If you’re an affiliate marketer or a publisher using affiliate content you probably already know the importance of having good data. If you’re serious about increasing your revenue you simply have to be able to measure how well your affiliate content is doing. With reliable data you can make the right decisions about what type of content to produce, which products and merchants are the best fit for your audience, and which traffic sources to invest in.
But how many affiliate marketers can be confident they’re making data-driven decisions about their affiliate content? From our experience we know that many publishers find themselves taking leaps in the dark - working on limited information to make decisions that can have a huge impact on their revenue.
You might already have an affiliate dashboard or affiliate reporting template but are finding that it’s too rigid or that it’s just not providing you with enough useful insight.
If this sounds all too familiar then fear not! We’ve put together some great tips to help you become the affiliate data superstar of your organization. Feel free to use our ideas to slice and dice data in ways that will have you coming up with new ideas in no time - whether it’s where to cut back, where to spend more, or which content to try to replicate.
So, let’s jump into our 5 favorite must have reports for an affiliate dashboard.
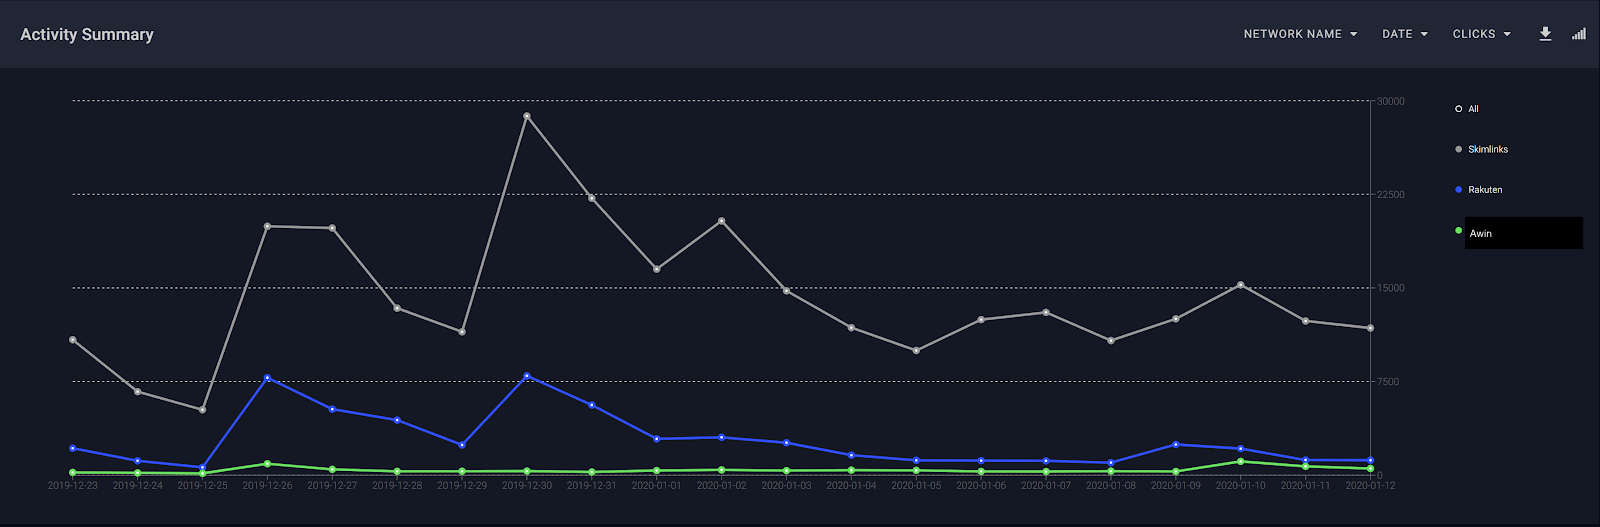
1) Affiliate Network Health
Before you start drilling down for insights you should first make sure that everything’s working as it should be and that there are no major problems that need to be immediately addressed. We recommend making sure you have a dashboard view that lets you check your affiliate network health on a daily basis. This way you can spot any suspicious spikes or drops in activity straight away.
2) Affiliate Program Overview
Similarly, you want to be able to have a general overview of your affiliate program performance. Keep an eye out for unexpected drops and spikes here too (for example, a sudden drop in conversion rate). For a general affiliate program overview we like to look at metrics such as clicks, gross orders, gross sales, and gross commissions. We also make sure we track KPIs like conversion rate and ROAS to keep a close eye on performance and find opportunities to maximize revenue.
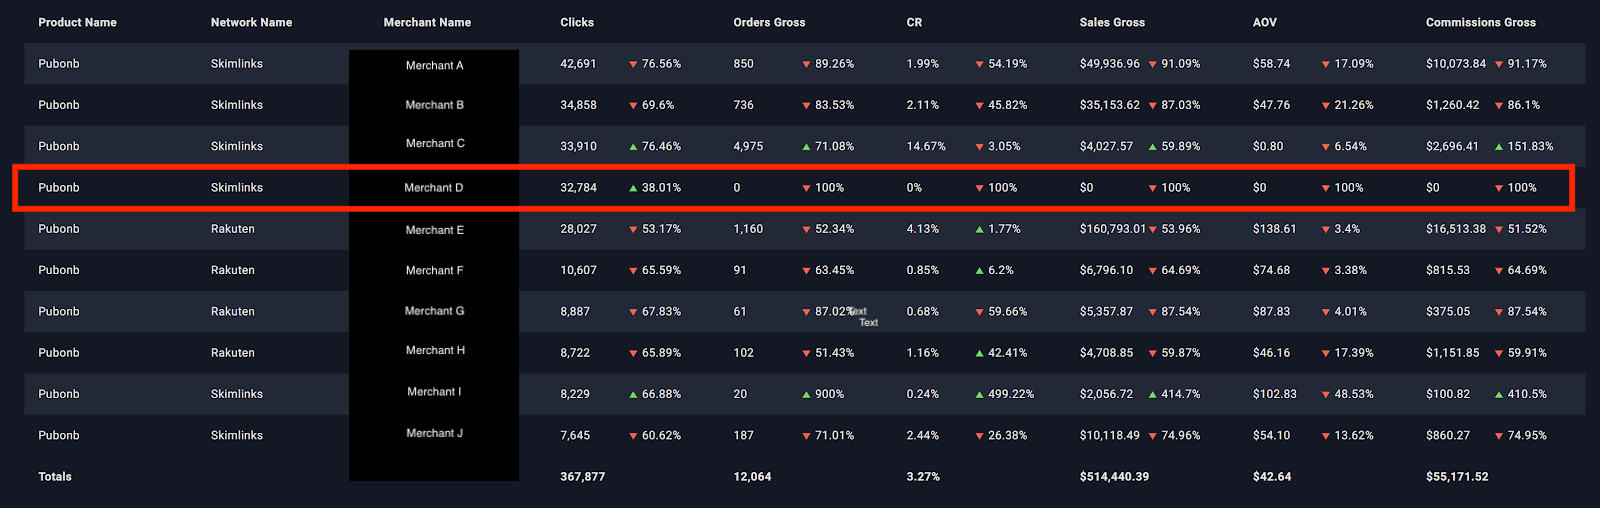
In the report above, for example, Merchant D seems to be experiencing some sort of issue as we can clearly see there is an increase in clicks, while orders and sales have dropped off completely. This is exactly the kind of thing your reports should be able to show you right away.
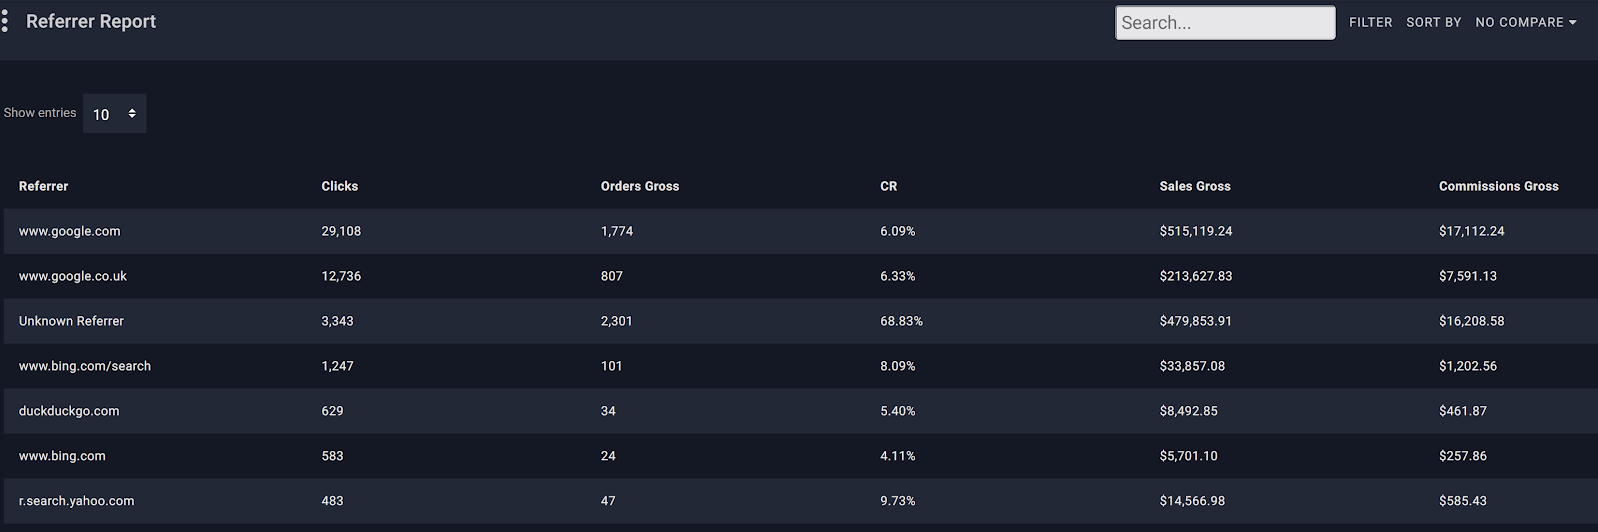
3) Revenue by Referral Source
You want to know where your best website traffic is coming from, and which individual content pieces are pulling it in. And even more importantly you want to know whether the traffic you’re bringing in is converting and generating actual affiliate sales. Being the savvy marketer that you are, we know you invest a lot of time and money into your SEM strategy. This makes it all the more crucial that you’re able to connect these efforts to your affiliate performance (and if you’re using Google Ads to bring in affiliate traffic and you’re struggling to connect sales back to specific campaigns and keywords, you can read our step by step guide on how to import your sales data into Google Ads here). For us, having a report breaking down revenue by traffic source is an absolute must.
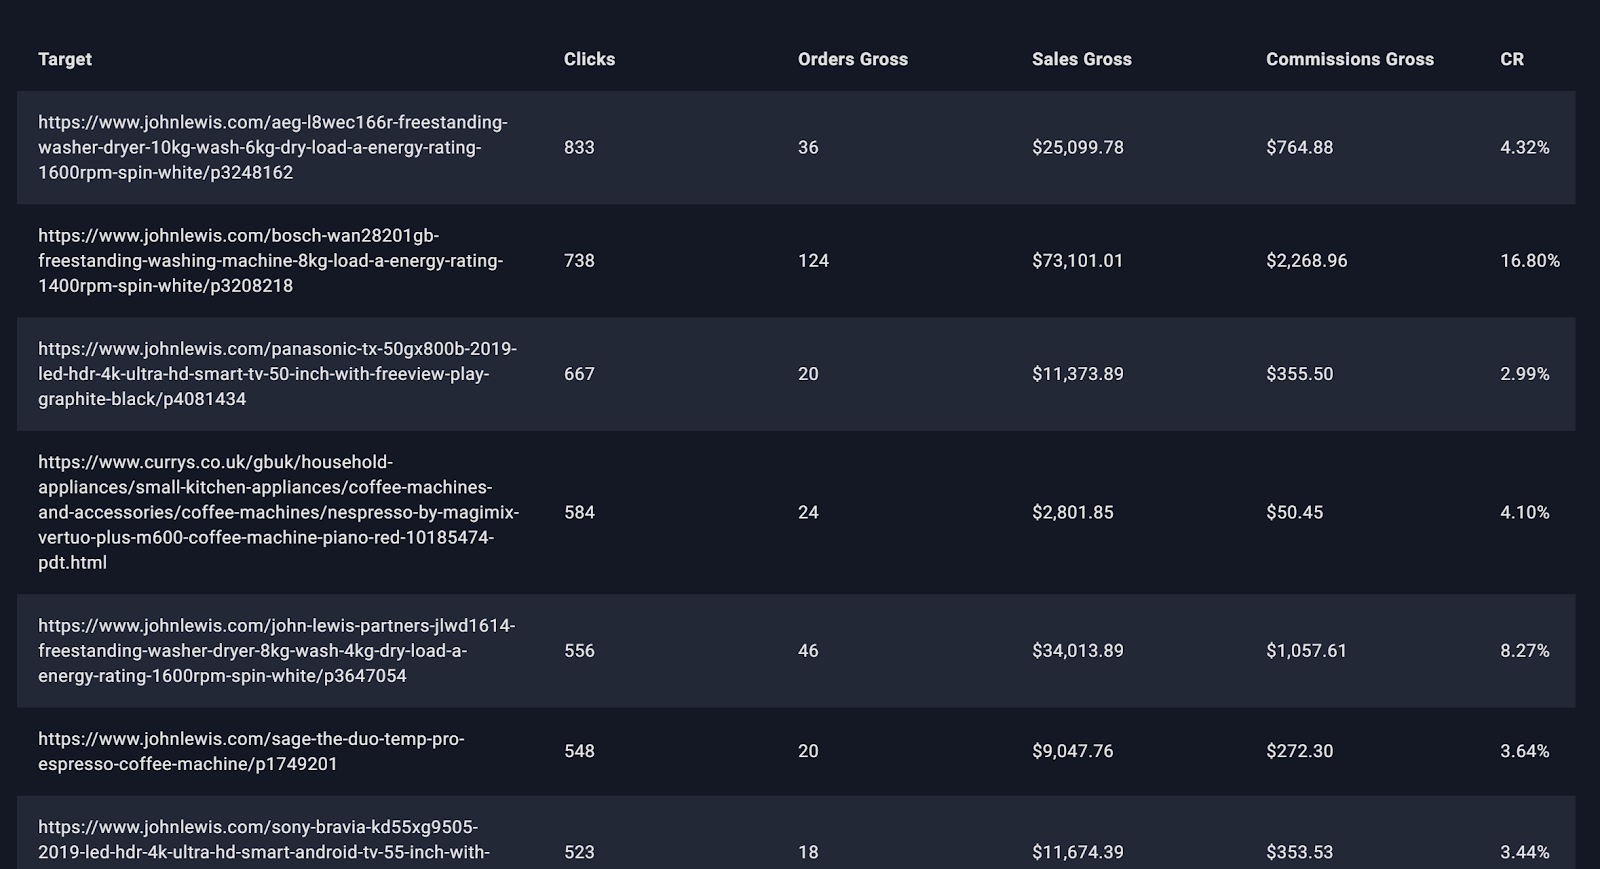
4) Top Performing Links
Links are the driving force of any affiliate program. That’s why it's so important to look at their individual performance metrics to look for any patterns or spikes in interest that you might be able to exploit and learn from. By focusing on link level performance, you can get a better understanding of which products are really resonating with your audience and find valuable new revenue opportunities.
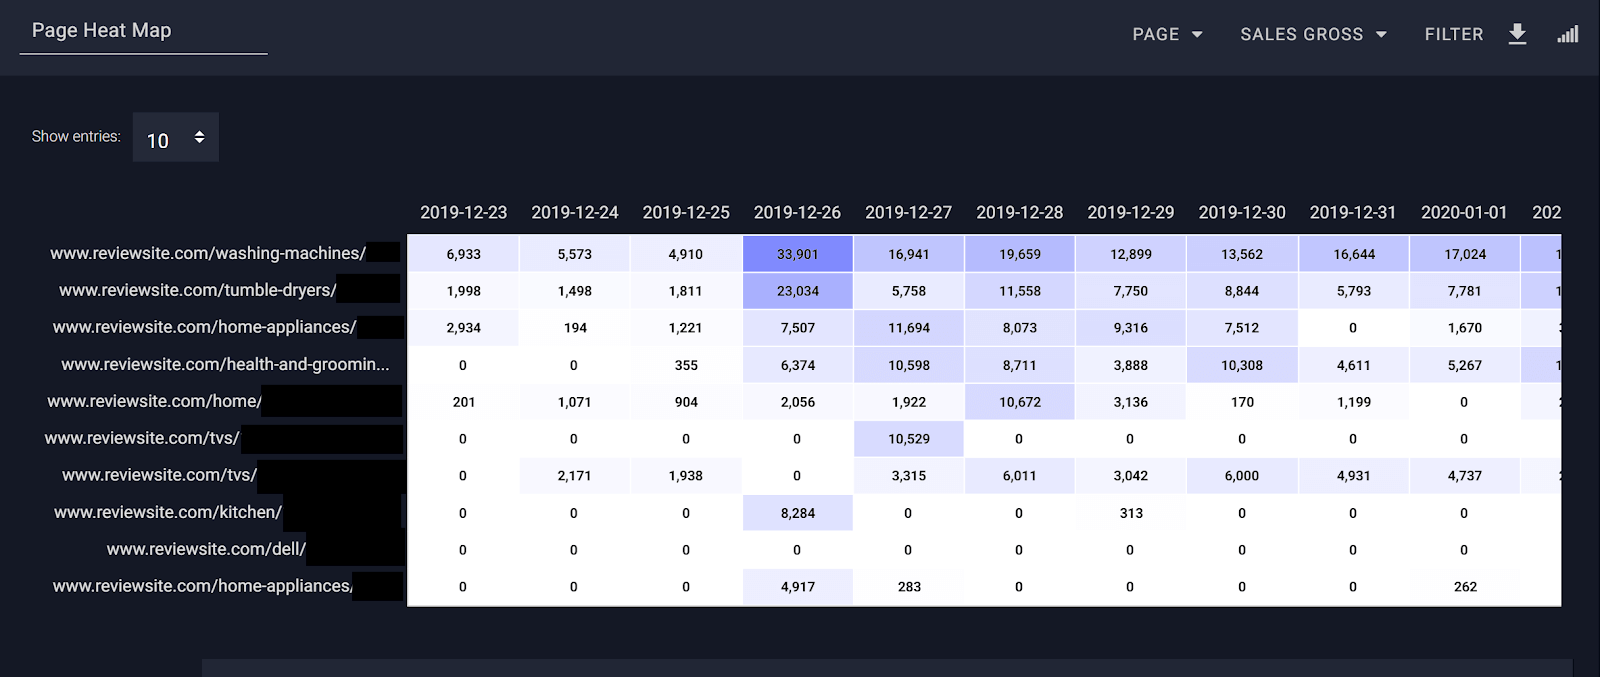
5) Top Performing Pages
You know better than anyone how valuable a good engaging piece of content can be. You need to be able to visualize how many affiliate sales and how much revenue has been generated by each page. This will tell you what kind of content you should be focusing on in the future, and which type of content needs to be improved. You’ll need to set up some advanced tracking to enable this level of analysis, but the opportunities for optimization are 100% worth it! You can even use a tool like Funnel Relay to get this configured for you.
Once you have this in place you can start doing some real data acrobatics by slicing the data in different ways. For example - combine it with your SEO data (from a tool like SEMrush for example) to see which keywords are bringing in traffic to your top performing pages. Once you know which keywords are most effective you can optimize your SEO (and paid) strategy accordingly!
Similarly you can combine your page level data with paid channel data to see which paid channels are bringing traffic to your most profitable pages. If your Facebook ads are bringing in the best traffic you’ll know where to start upping your spend!
And you could get even more granular and see which retailers or products are bringing in the most affiliate revenue on each page. Use this data to discover partnerships you want to expand on and to find ever more innovative ways of maximizing your affiliate revenue.
In Summary
There are endless ways to visualize and slice and dice your data. We think these are the most important affiliate reports and visualizations to start with. But above all you need to have the flexibility to drill down and discover the value in your data.
If you need any help capturing or consolidating your affiliate data, feel free to get in touch.
Or if you’d like an out-of-the-box solution so that you can get these visualizations up and running in no time, you can schedule a demo.